Tasks
Tasks represent individual units of planned field work, each with a map location, resource requirements (materials, equipment, labour), and progress tracking. A task might be installing a junction box at a specific building, running 500 m of cable along a route, or conducting an inspection in a defined area. Tasks are versioned, so teams can plan offline, batch-create work, and roll back changes before committing to the shared dataset.
Task Structure
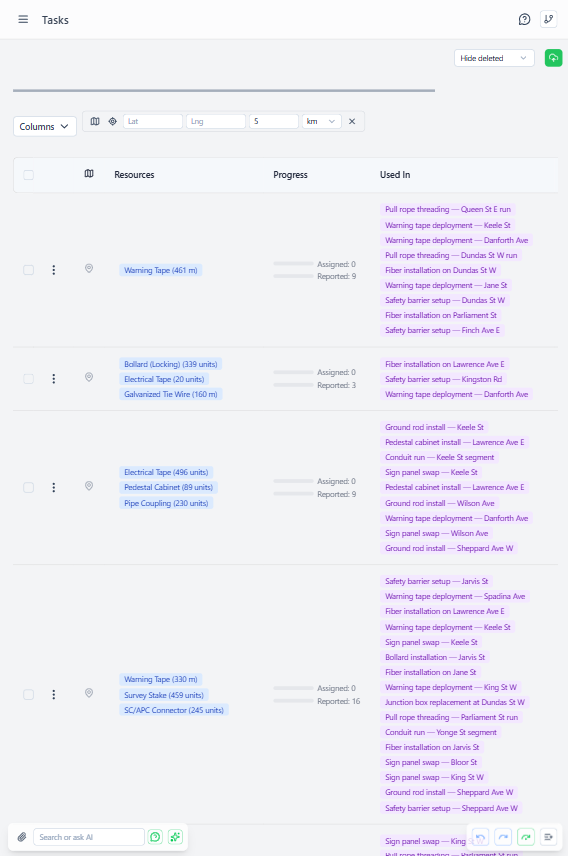 Tasks page showing planned work with progress tracking and multi-resource requirements
Basic Fields:
- Name - Descriptive task name
- Description - Detailed work instructions
- Geometry - Point, line, or polygon showing work location
- Order - Parent work order grouping related tasks
- Resources - Array of required materials/labor (multi-resource support)
Resource Requirements: Each resource entry includes:
resource- Resource definition referencevolume- Quantity/amount requireduom- Unit of measure
Example:
Task: "Install network junction box at Building 42"
Geometry: Point (lat: 40.7128, lng: -74.0060)
Resources: [
  { resource: "Junction Box", volume: 1, uom: "units" },
  { resource: "Cat6 Cable", volume: 15, uom: "meters" },
  { resource: "Mounting Screws", volume: 8, uom: "units" },
  { resource: "Electrician", volume: 2, uom: "hours" }
]
Multi-Resource Tasks
Prior system: One resource per task
- Problem: Complex work creates excessive map markers
- Example: 100 installations × 4 resources = 400 map points
Current system: Multiple resources per task
- Solution: Single map marker represents complete work
- Same example: 100 map points (one per installation)
- Cleaner map, easier spatial planning
Benefits:
- Reduced map clutter
- Grouped related materials (door + screws + adhesive = one task)
- Progress tracked across all resources
Tasks Are Versioned
Unlike assignments/reports, tasks use version/commit workflow:
Why Versioned:
- Admins design work areas offline (subway tunnels, remote sites)
- Spatial conflict detection needed (overlapping geography)
- Batch operations common (redesign entire campaign)
- Rollback valuable (undo entire planning change)
Workflow:
- Create version (draft mode)
- Add/edit tasks in draft
- Spatial validation (check for overlaps)
- Commit version → tasks become "official"
- Workers see committed tasks in assignments
Offline Collaboration: Multiple admins can create separate versions:
- Admin A: Plan north region tasks
- Admin B: Plan south region tasks
- Both work offline, commit later
- Conflict resolution if overlapping geography
Task Geometry Types
Point Tasks
Single location work (equipment installation, inspection).
Example: Install junction box
Geometry: { type: "Point", coordinates: [lng, lat] }
Line Tasks
Linear work (cable runs, pipeline installation).
Example: Run 500m of fiber optic cable
Geometry: { type: "LineString", coordinates: [[lng1,lat1], [lng2,lat2], ...] }
Polygon Tasks
Area-based work (coverage zones, service areas).
Example: Door-to-door outreach in neighborhood
Geometry: { type: "Polygon", coordinates: [[[lng1,lat1], ...]] }
Proximity Filtering
Find tasks near specific locations:
Use Case: Worker at warehouse wants tasks nearby
- Open Tasks page
- Click "Filter Nearby" button
- Drag map marker to warehouse location
- Set distance (e.g., 5km)
- Table shows only tasks within radius
Row Action: Click "Filter Nearby" on task row → auto-sets proximity to that task's location
Task Usage in Work Orders
Tasks appear in assignments as available work options:
Flexible Allocation:
- Work order might have 10 tasks available
- Resource targets require completing 1-2 of those tasks
- Worker chooses which tasks to complete (flexibility)
- Over-allocation by 10x common (more options than targets)
Example:
Work order to John:
  Resource Targets: 50m cable, 20 junction boxes
  Available Tasks: [Task1, Task2, Task3, ... Task30]

John completes:
  Task 5: 30m cable, 12 junction boxes
  Task 12: 20m cable, 8 junction boxes
  Total: Met cable target, met junction box target
Worker had 30 task options to meet targets - high flexibility.
Task Progress Tracking
Calculation: Progress = Average completion across all resources
Example:
Task with 3 resources:
  - Cat6 Cable: 10m required, 5m completed = 50%
  - Screws: 8 required, 8 completed = 100%
  - Labor: 2 hours required, 0 hours reported = 0%

Overall progress = (50% + 100% + 0%) / 3 = 50%
Visual Indicators:
- Progress bar: Green ≥100%, Yellow ≥50%, Red <50%
- Geometry indicator: Green check if valid point/line/polygon
- Used in: Shows which assignments/reports reference this task
Creating Tasks
Access Required: tasksCreate admin right
Workflow:
- Navigate to Fulfillment → Tasks
- Create new version (or edit existing draft)
- Click "Add Task" in version
- Fill basic info (name, description)
- Select order (parent grouping)
- Click map to set geometry
- Add resources (can add multiple)
- Save task in draft
- Commit version when planning complete
Best Practices:
- Group related materials in single task (reduces map clutter)
- Use consistent naming (e.g., "Install - Junction Box - Building 42")
- Set realistic resource volumes (inform inventory planning)
- Include labor resources (helps staffing calculations)
Bulk Task Generation
Create many similar tasks efficiently:
Scenario: Install 100 junction boxes at different buildings
Method 1: Import from GeoJSON
- Create GeoJSON with 100 points
- Each feature has properties: name, description, resources
- Import → creates 100 tasks in one version
Method 2: Generate from Map Selection
- Select 100 existing building features on map
- Click "Generate Tasks"
- Choose task template (resource requirements)
- Creates task at each building location
Method 3: Copy Existing Task
- Select task with correct resource configuration
- Click "Duplicate Task"
- Edit geometry to new location
- Repeat for similar installations
Batch Print Tasks
A project may contain dozens or hundreds of tasks. Rather than printing each one from its detail page, use the project-level Print all tasks action:
- Open the parent project's detail page (
/fulfillment/projects/:id) - Click Print all tasks in the header
- The batch print view opens at
/fulfillment/tasks/batch/[ids]— a comma-separated list of task IDs in the URL - Screen shows 10 tasks per page (paginated, CSS-driven — all records are in the DOM so printing emits everything)
- Print the page — each task is separated by a hard page break, so you get one task per printed page
Notes:
- Safety cap: the batch view is limited to 200 tasks per print run. If the project exceeds this, a banner warns you and tasks beyond 200 are truncated — split the print into smaller batches if needed.
- No new server work is involved — the batch view reads the existing
/api/tasks/get?_id=csvendpoint and renders each task using the sameRecordDetail*components as the individual task page, so the printed content matches what you'd get printing tasks one-by-one.
Task Validation
Before version commit, system validates:
Spatial Conflicts:
- Overlapping polygons (two tasks covering same area)
- Point tasks too close together (configurable threshold)
- Line tasks crossing restricted zones
Resource Availability:
- Warning if required resources not in inventory
- Doesn't block commit (tasks may be future-dated)
- Helps procurement planning
Geometry Validity:
- Points must have valid coordinates
- Lines must have at least 2 points
- Polygons must close (first point = last point)
Task Work Order Lifecycle
Typical Flow:
- Planning - Admin creates tasks in draft version
- Commit - Version committed, tasks become official
- Work Order - Tasks added to worker assignments (availableTasks array)
- Execution - Worker completes some of the available tasks
- Reporting - Worker links the completed task in their field report
- Progress - Task progress updated based on completed work
- Completion - When all resources at 100%, task marked complete
Task Reuse: Tasks can appear in multiple assignments:
- Same task assigned to multiple workers (split work)
- Task partially completed by one worker, finished by another
- Progress aggregated across all reports
Viewing Task Details
Task Detail Page Shows:
- Basic information and geometry
- Resource requirements list
- Progress bar and percentage
- Used in: Work orders and reports referencing this task
- Version history (which versions modified this task)
- Spatial relation to nearby tasks
Map View:
- Color-coded by progress (red = not started, yellow = partial, green = complete)
- Geometry type indicators (icon for point, line style, polygon fill)
- Clickable for quick detail popup
- Filterable by order, progress, proximity